自定义配置
1
2
3
4
5
6
7
8
9
10
11
12
13
14
15
16
17
18
19
20
21
22
23
24
25
26
27
28
29
30
| kubectl apply -f prometheus/kube-monitoring.yml
kubectl apply -f prometheus/
kubectl get all -n kube-monitoring
NAME READY STATUS RESTARTS AGE
pod/blackbox-exporter-c74476589-666pr 1/1 Running 0 79s
pod/grafana-core-0 1/1 Running 0 79s
pod/node-exporter-4rchc 1/1 Running 0 79s
pod/node-exporter-lwdzv 1/1 Running 0 79s
pod/prometheus-8dddc46f6-xwbls 1/1 Running 0 79s
NAME TYPE CLUSTER-IP EXTERNAL-IP PORT(S) AGE
service/blackbox-exporter ClusterIP 10.99.8.217 <none> 9115/TCP 79s
service/grafana NodePort 10.105.75.210 <none> 3000:30011/TCP 79s
service/prometheus NodePort 10.111.64.106 <none> 9090:30732/TCP 79s
NAME DESIRED CURRENT READY UP-TO-DATE AVAILABLE NODE SELECTOR AGE
daemonset.apps/node-exporter 2 2 2 2 2 <none> 79s
NAME READY UP-TO-DATE AVAILABLE AGE
deployment.apps/blackbox-exporter 1/1 1 1 79s
deployment.apps/prometheus 1/1 1 1 79s
NAME DESIRED CURRENT READY AGE
replicaset.apps/blackbox-exporter-c74476589 1 1 1 79s
replicaset.apps/prometheus-8dddc46f6 1 1 1 79s
NAME READY AGE
statefulset.apps/grafana-core 1/1 79s
|
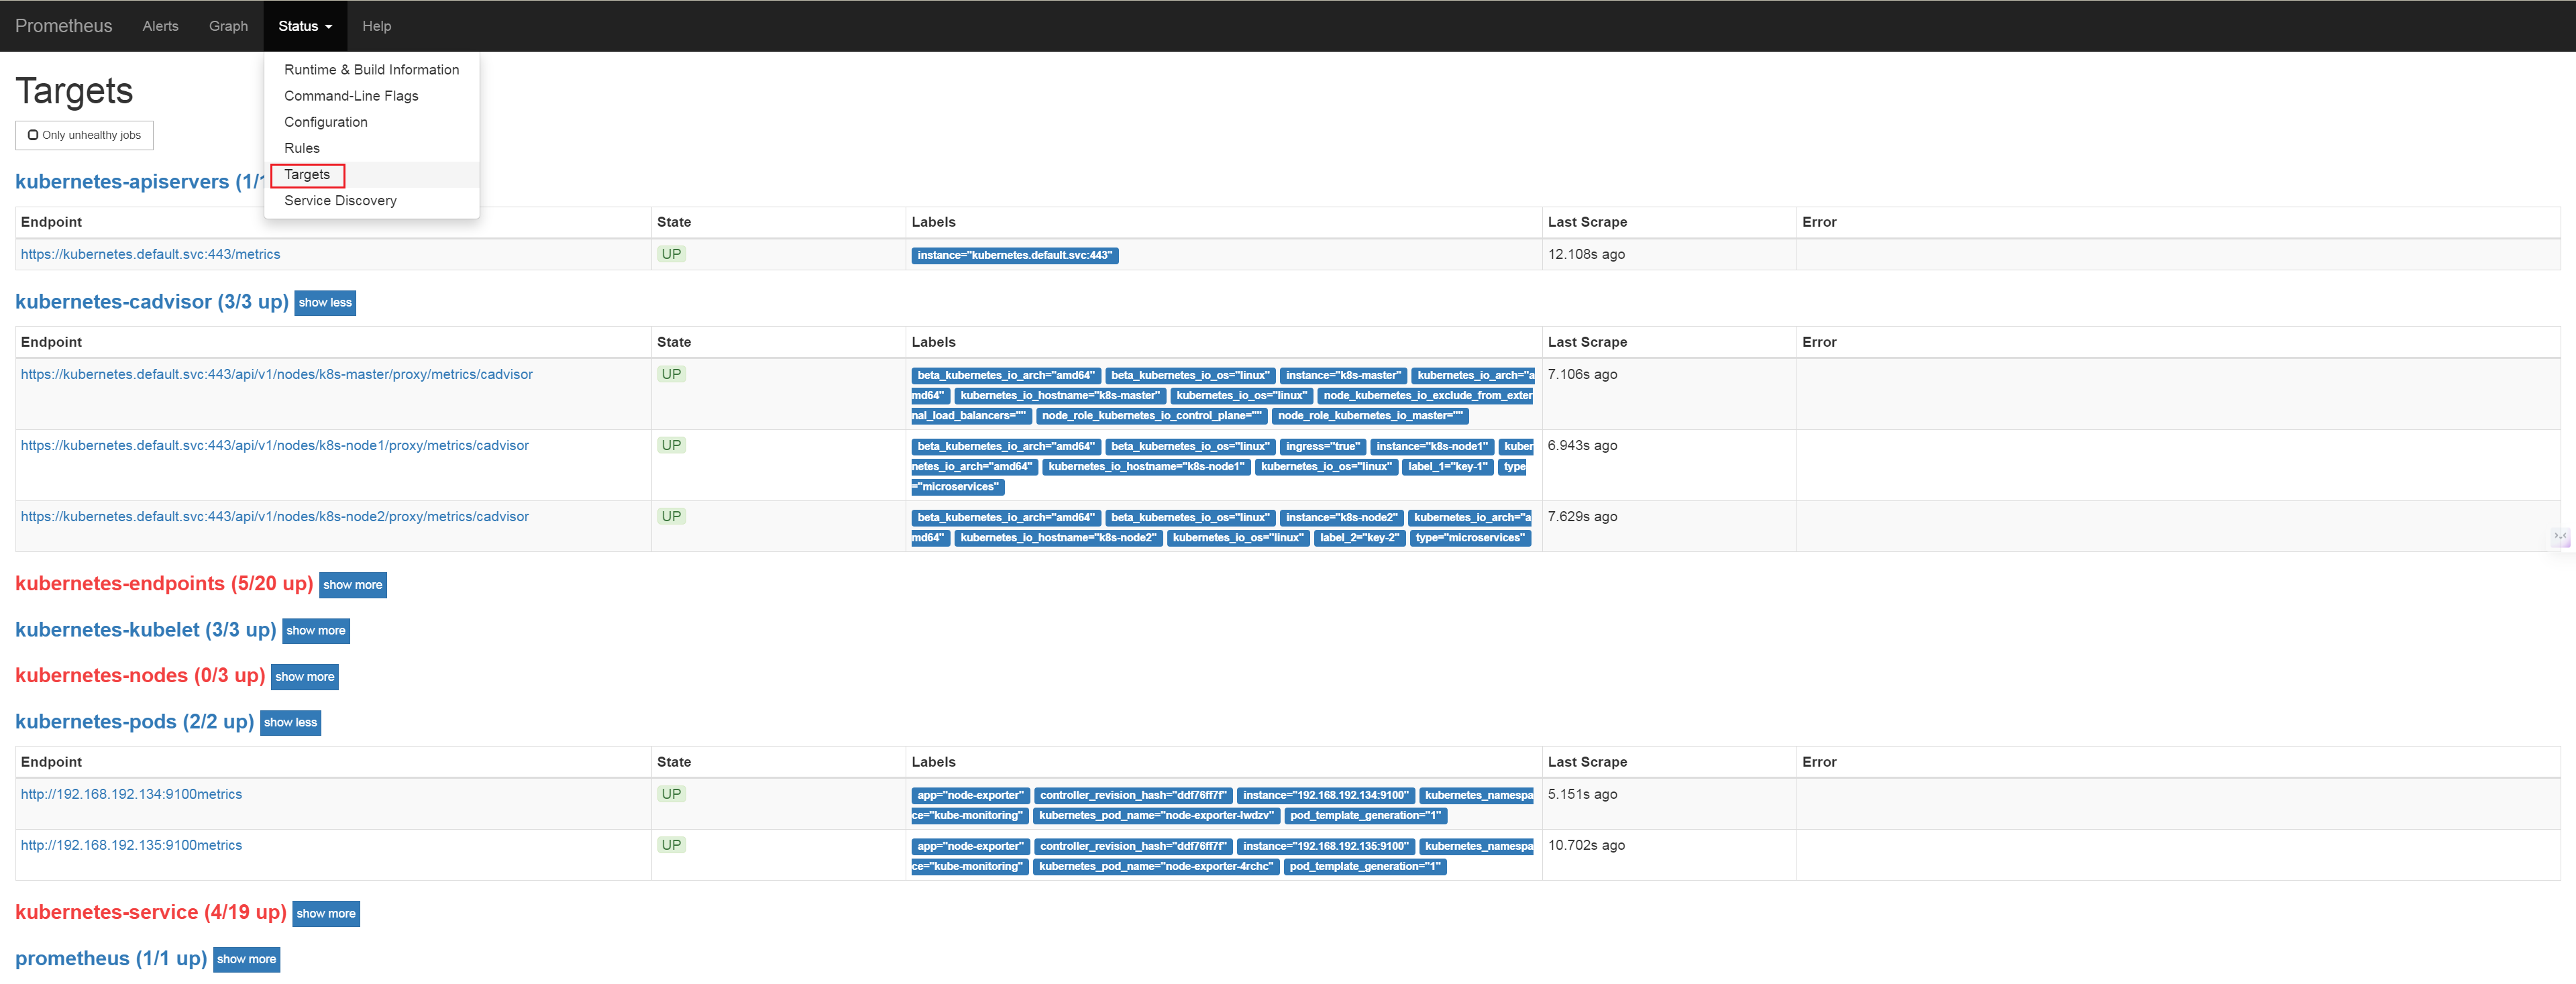
访问prometheus
访问IP:30732即可访问prometheus
在Status->Targets中即可看到监控的内容
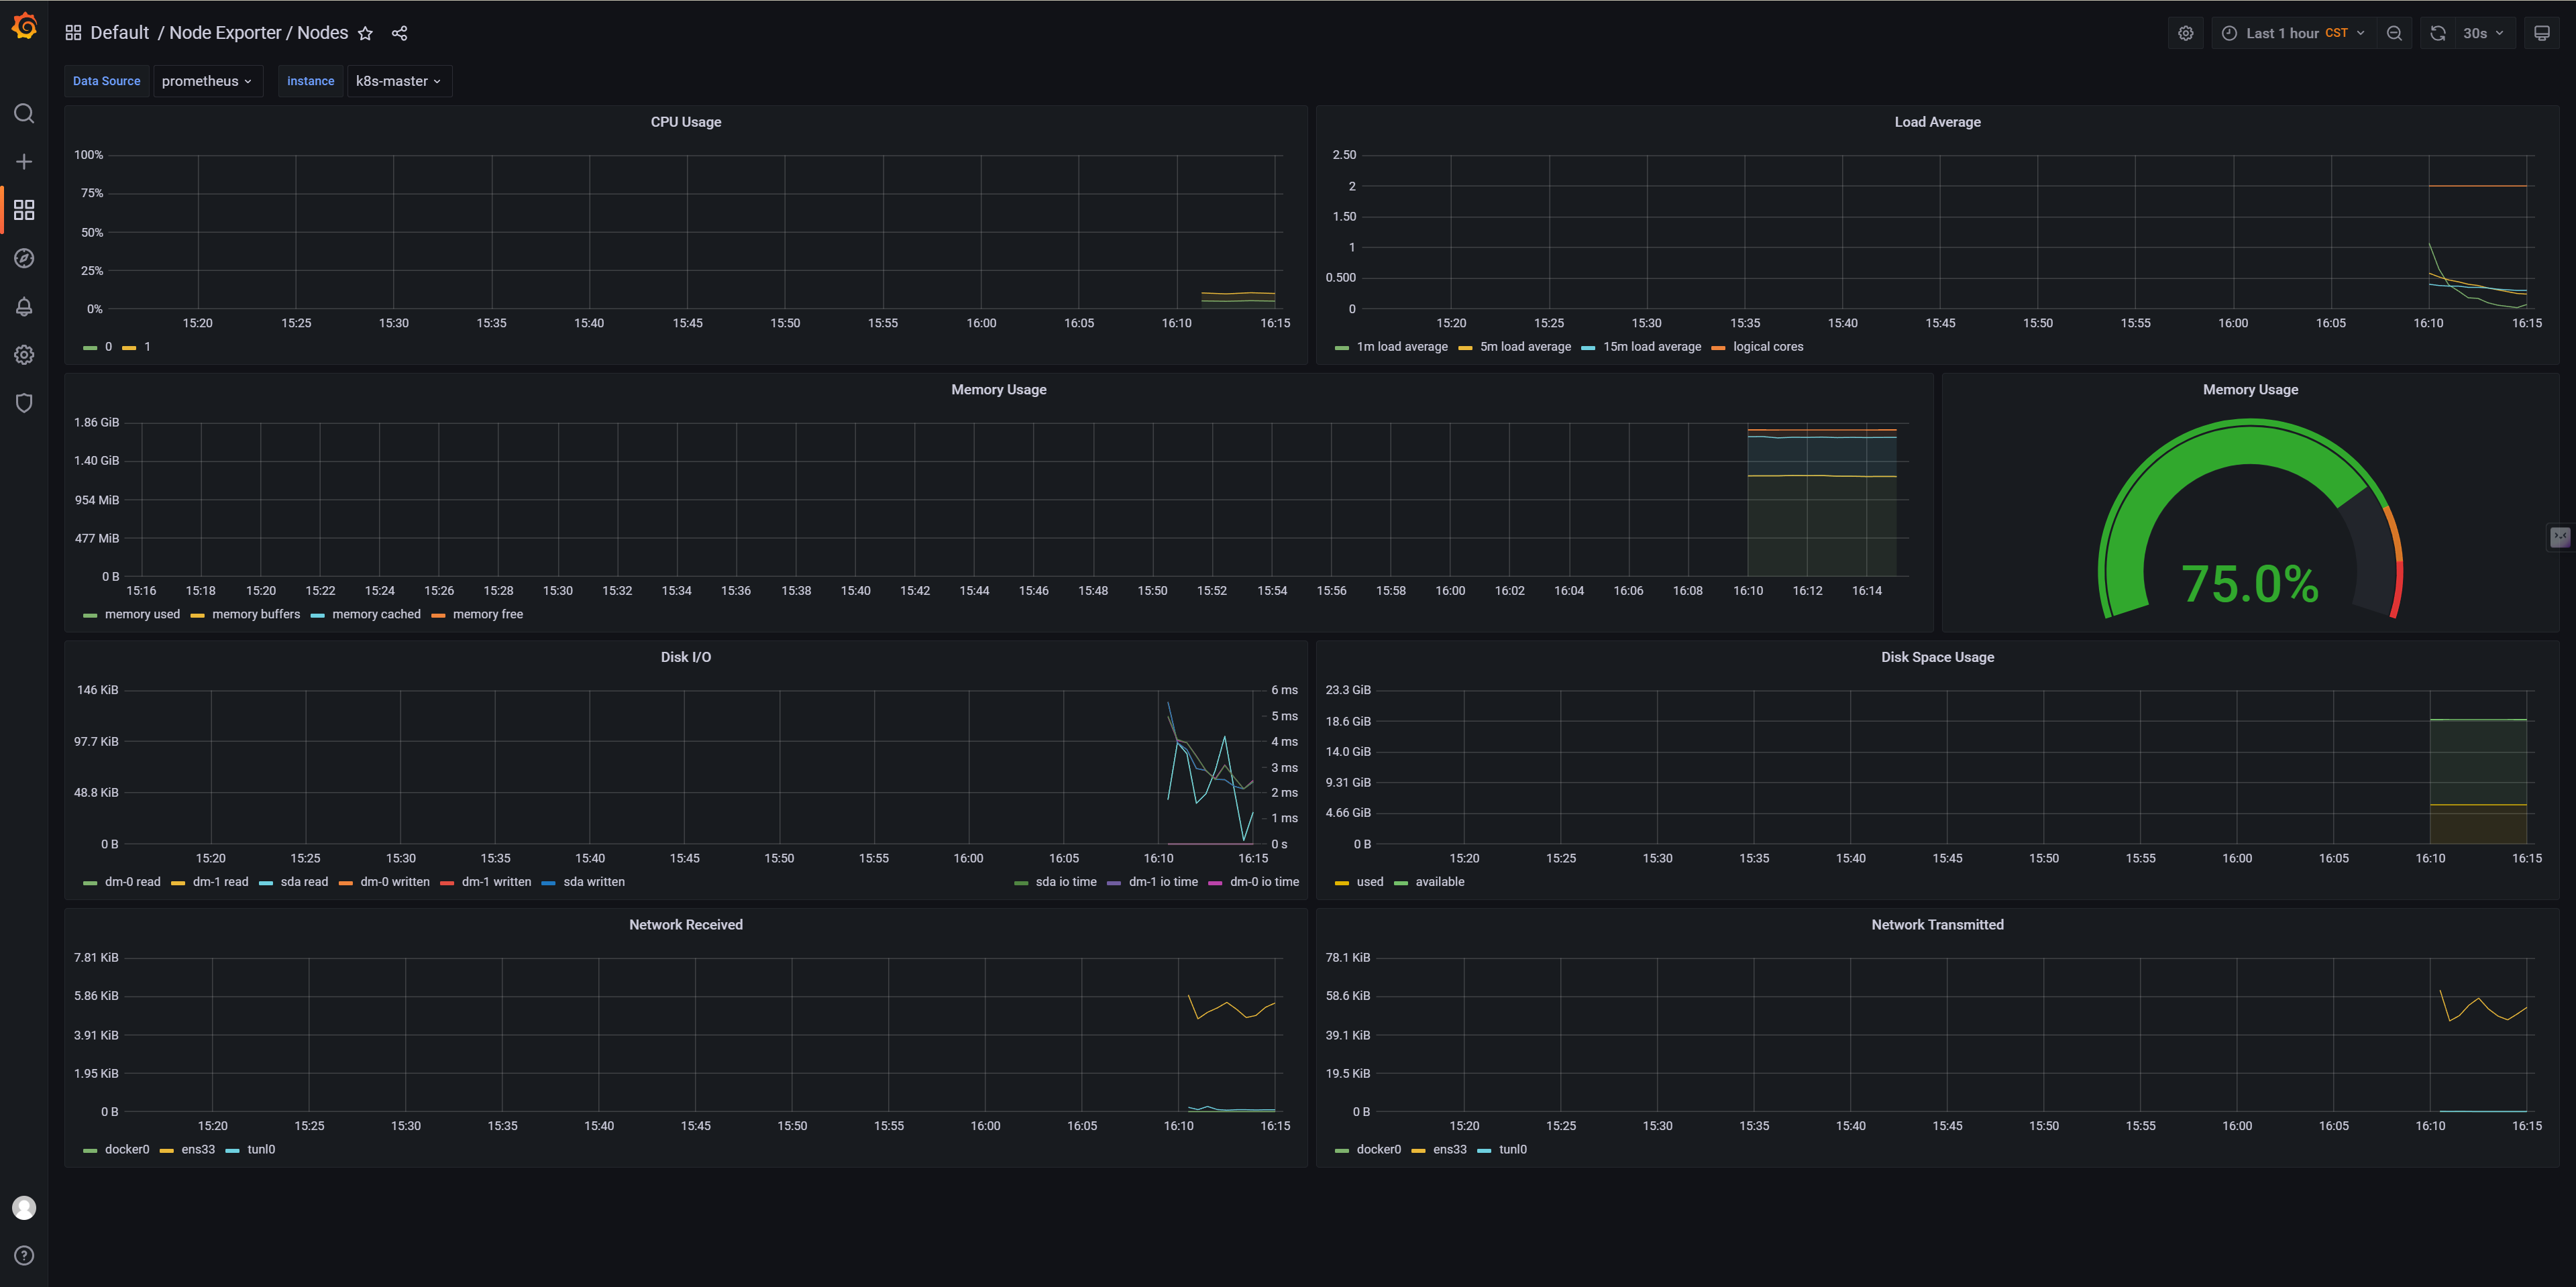
访问grafana
访问IP:30011即可访问grafana
第一次登陆,用户名和密码都是admin
只要按照首页的提示完成下面的步骤即可使用Grafana
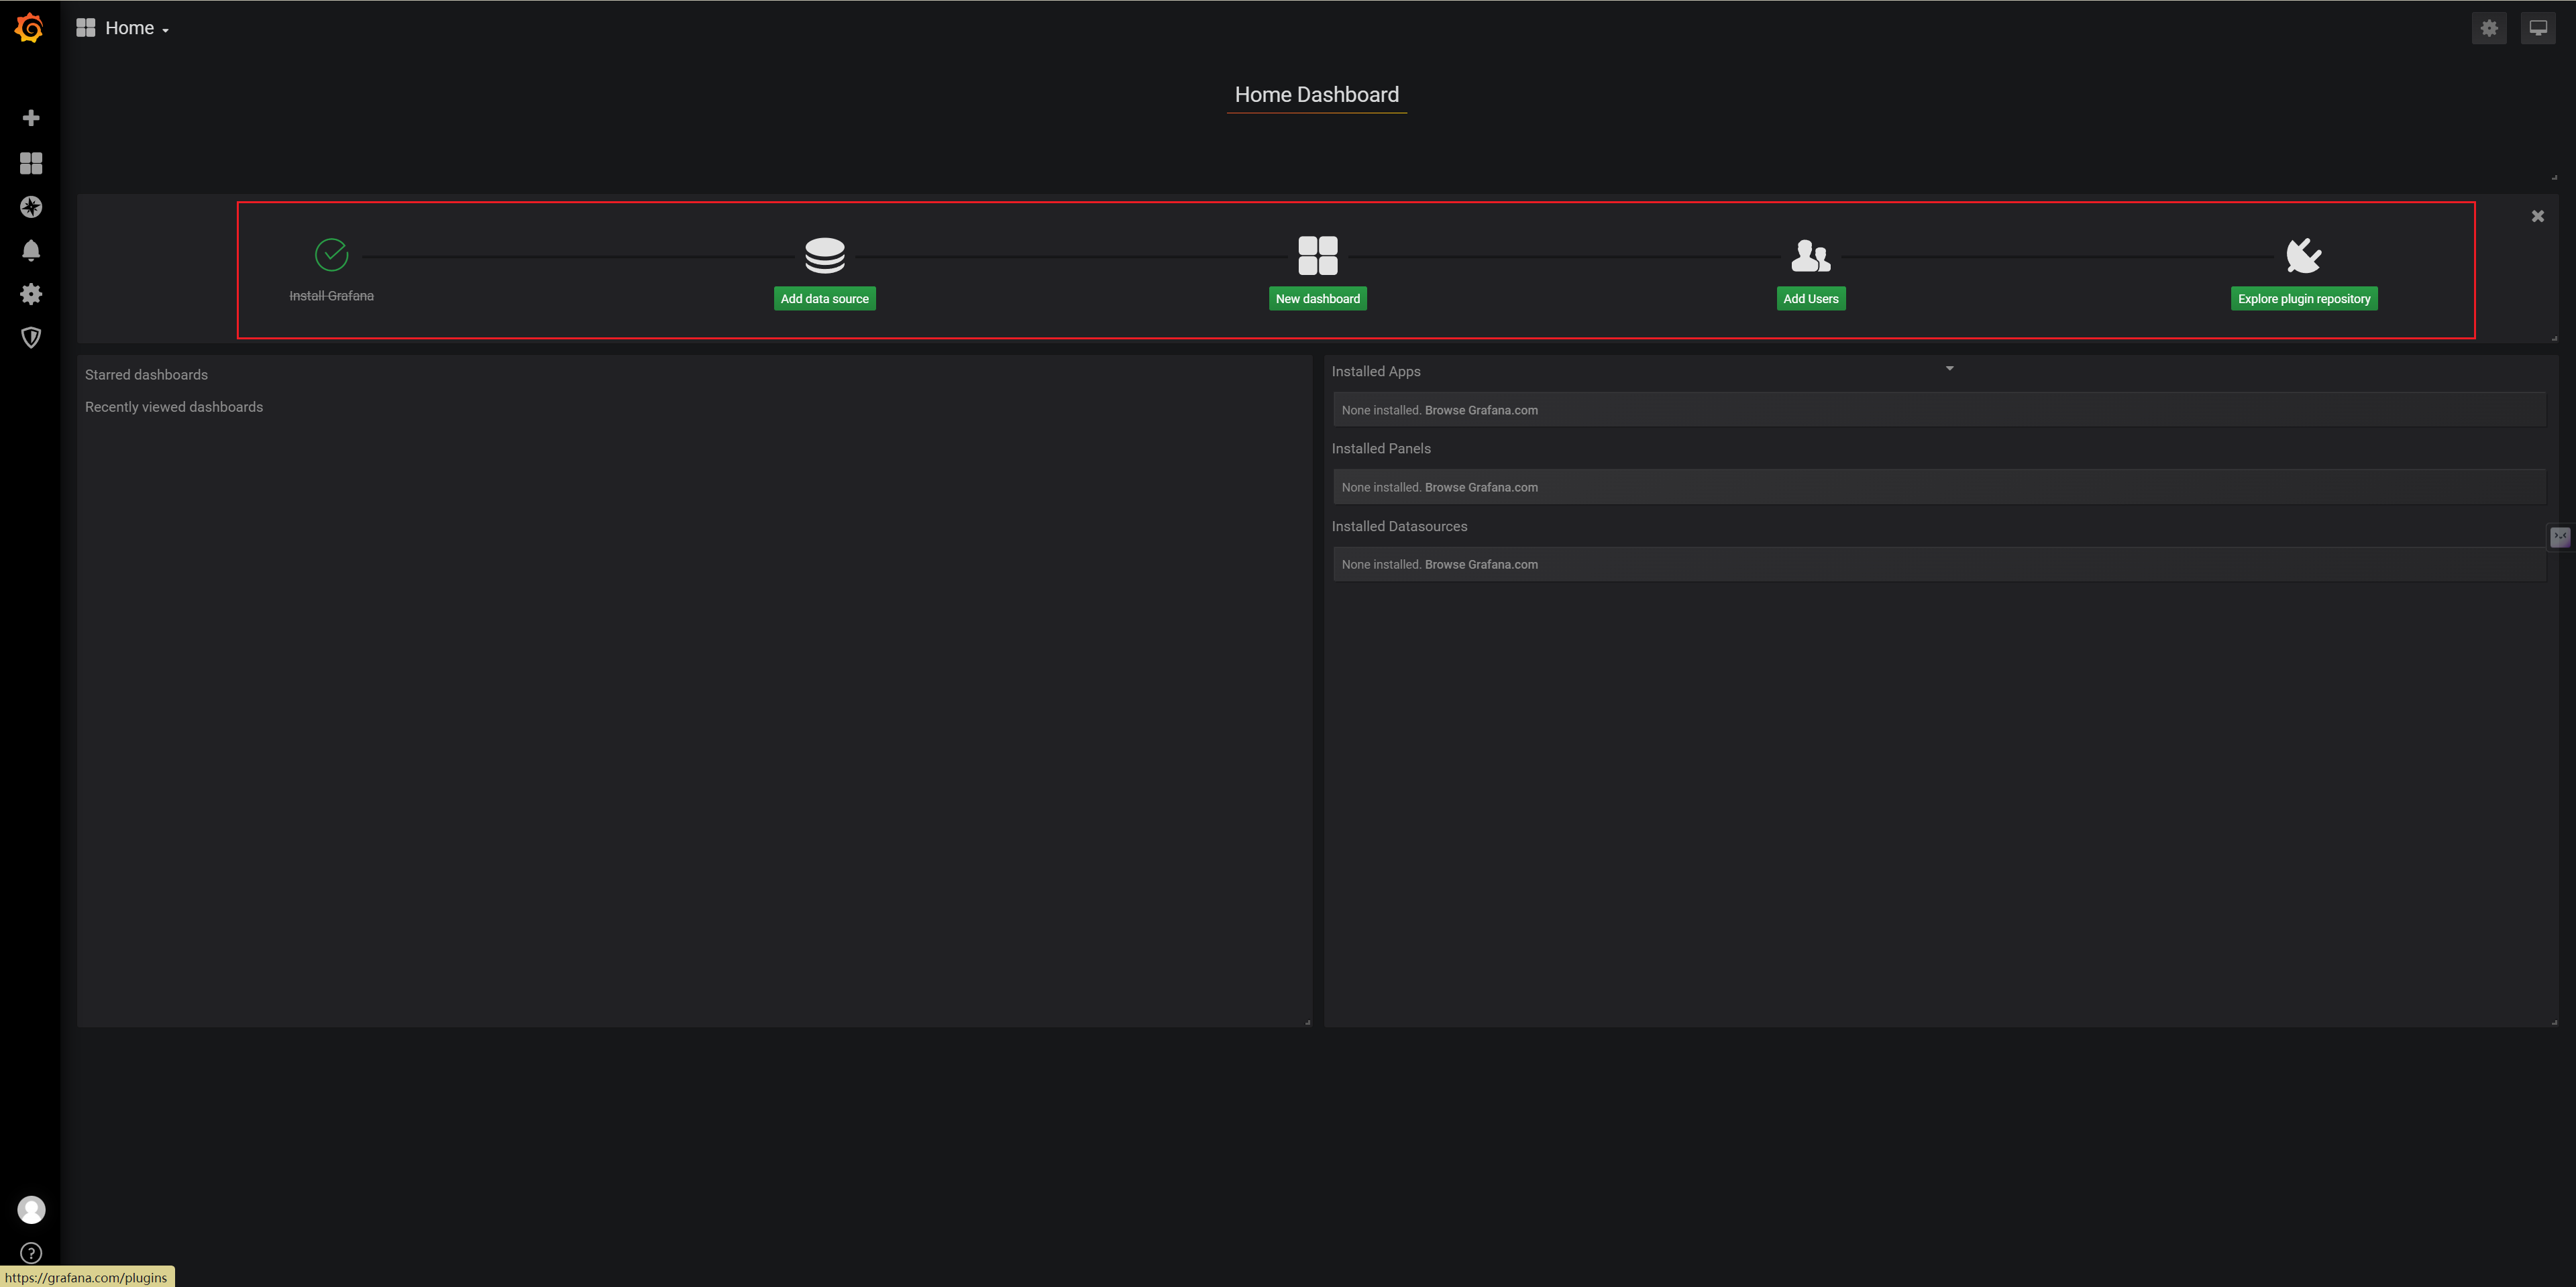
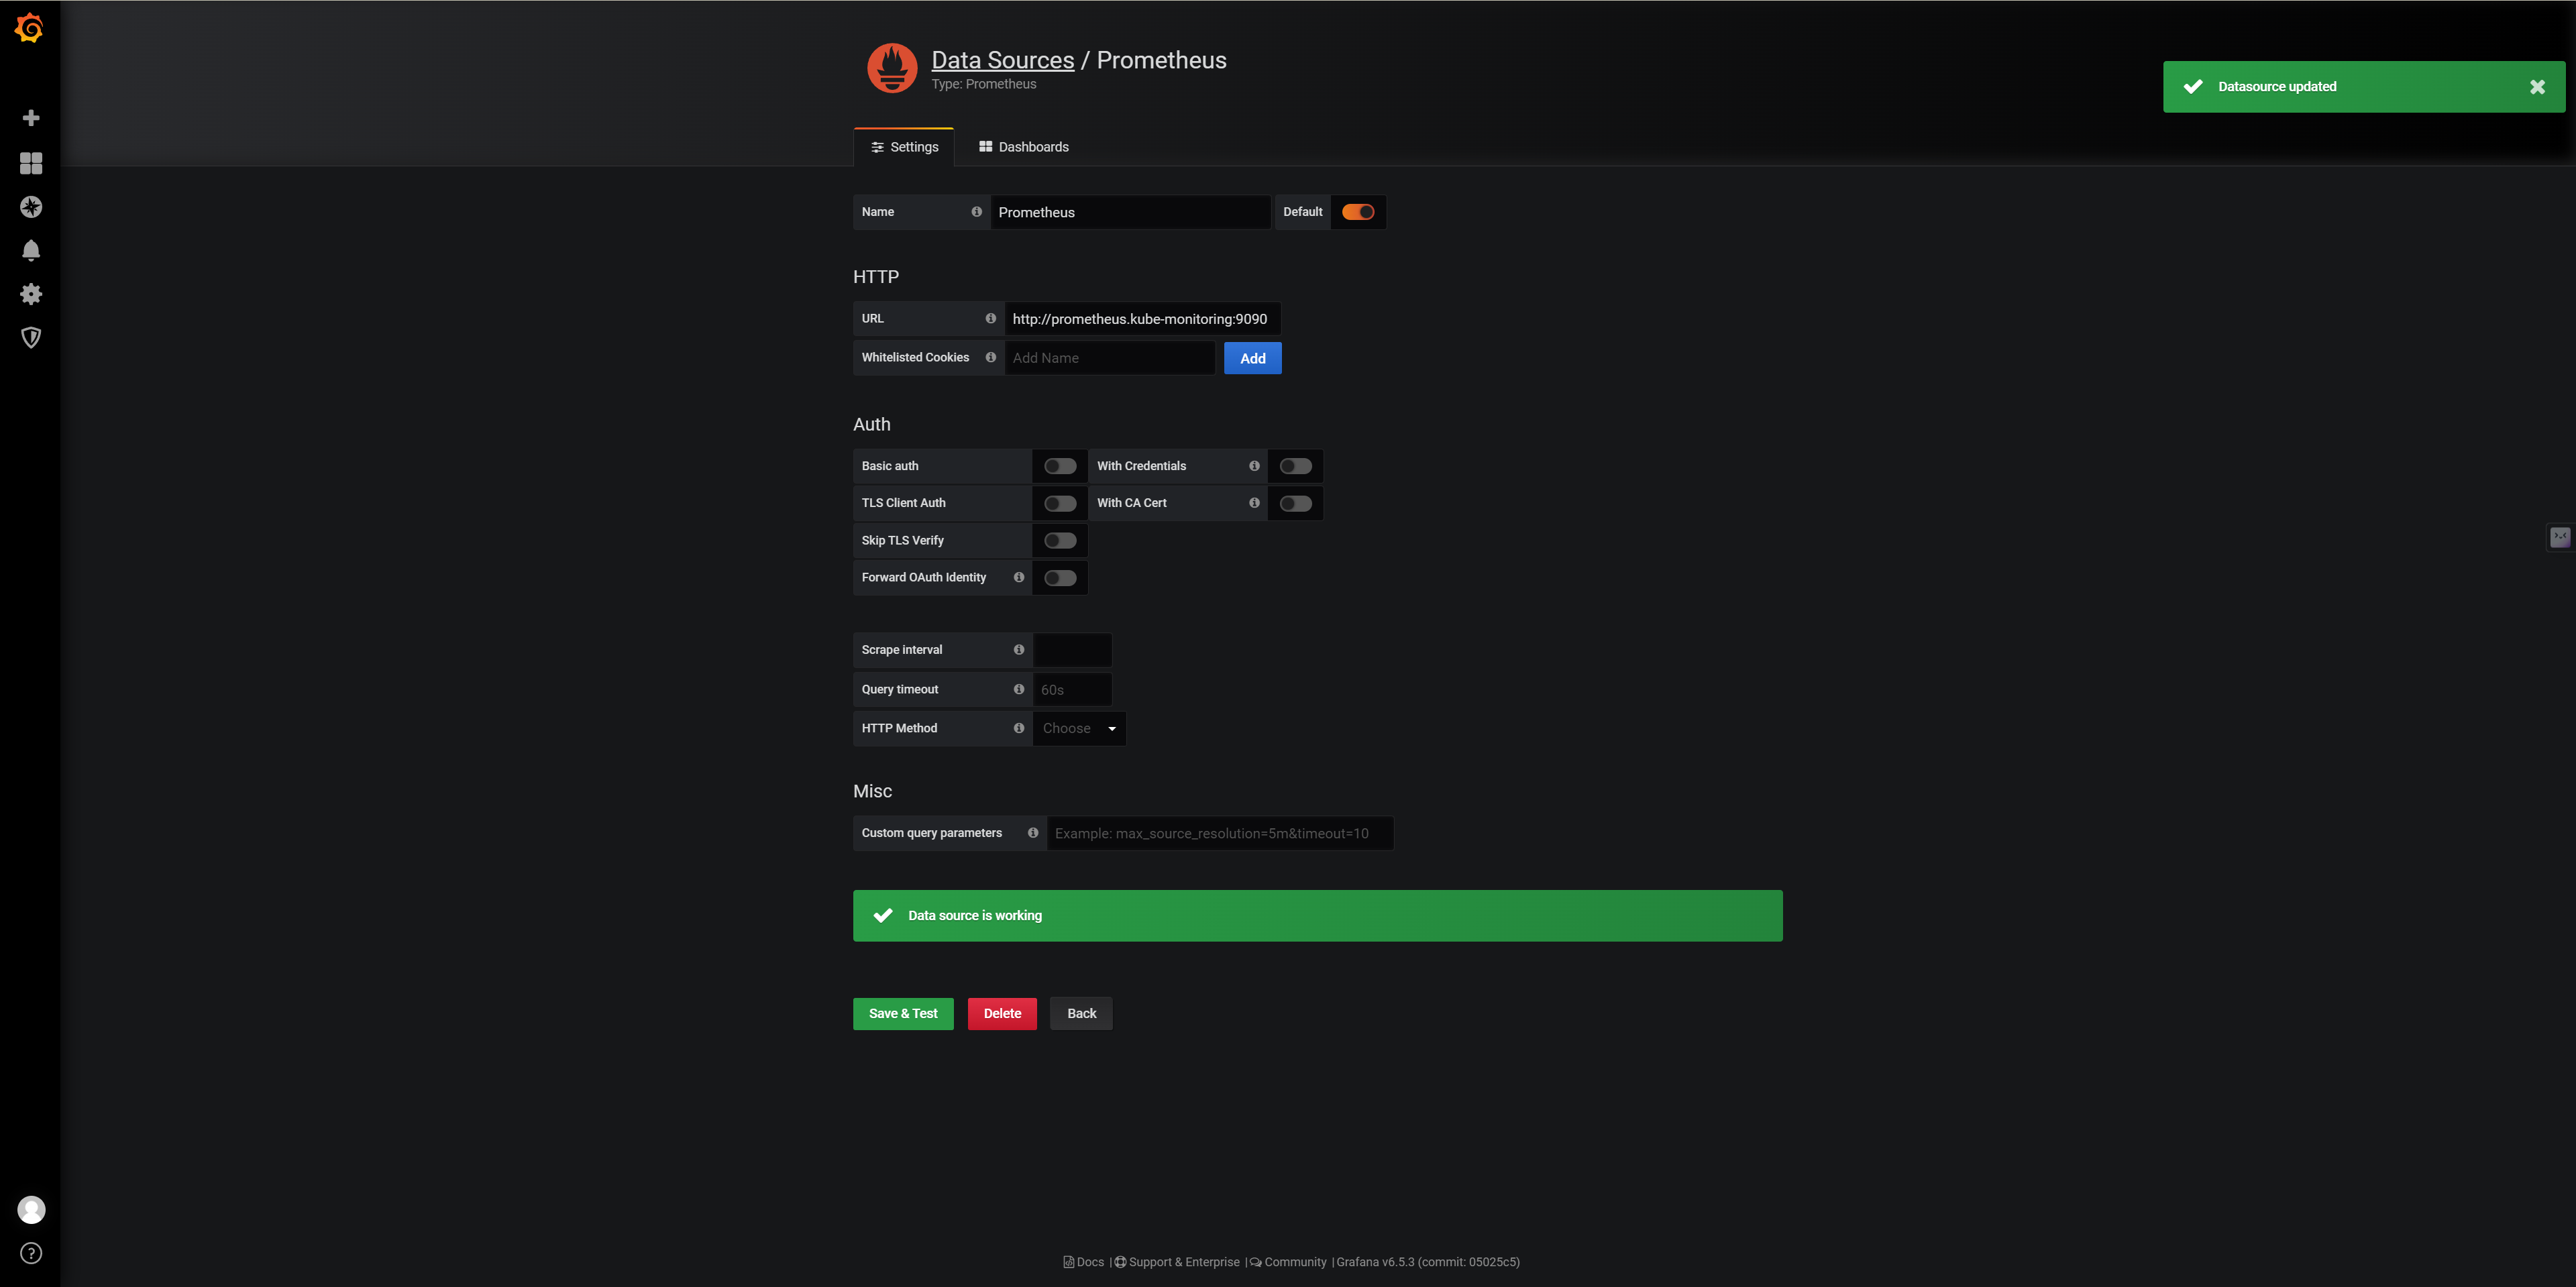
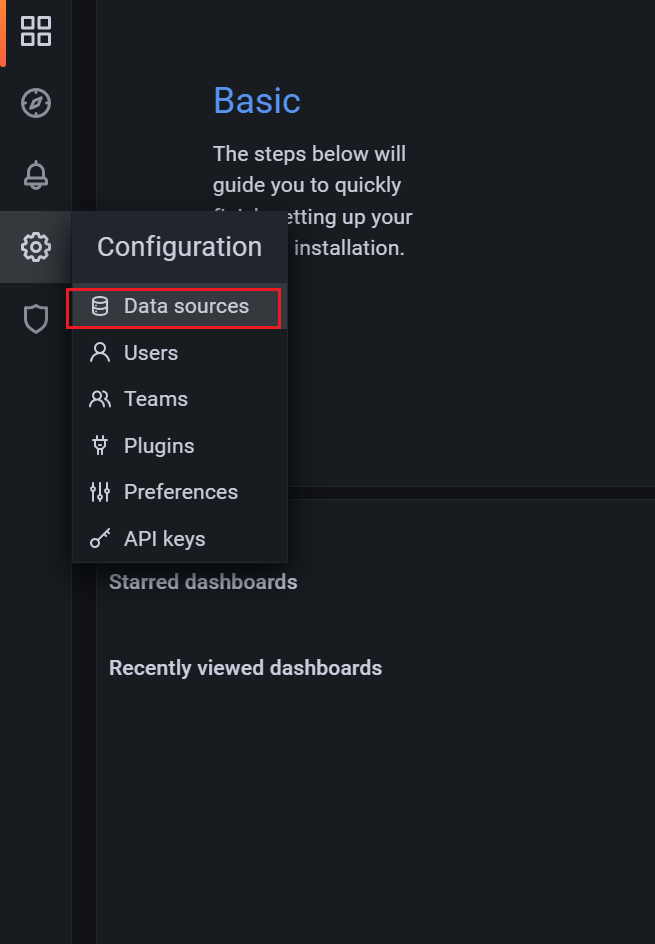
Add data source
选择Prometheus
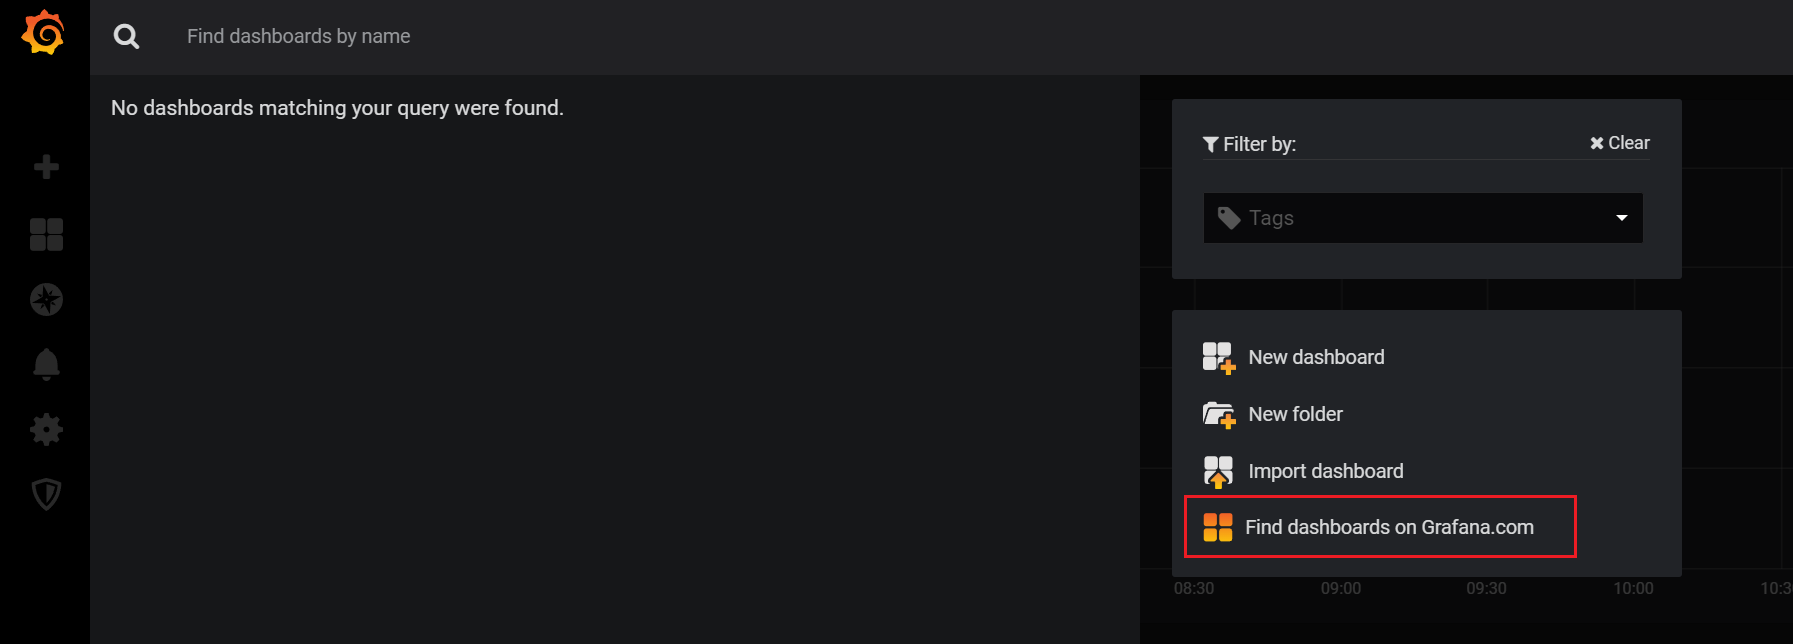
New dashboard
点击左上角的New dashboard,然后点击Find dashboards on Grafana.com
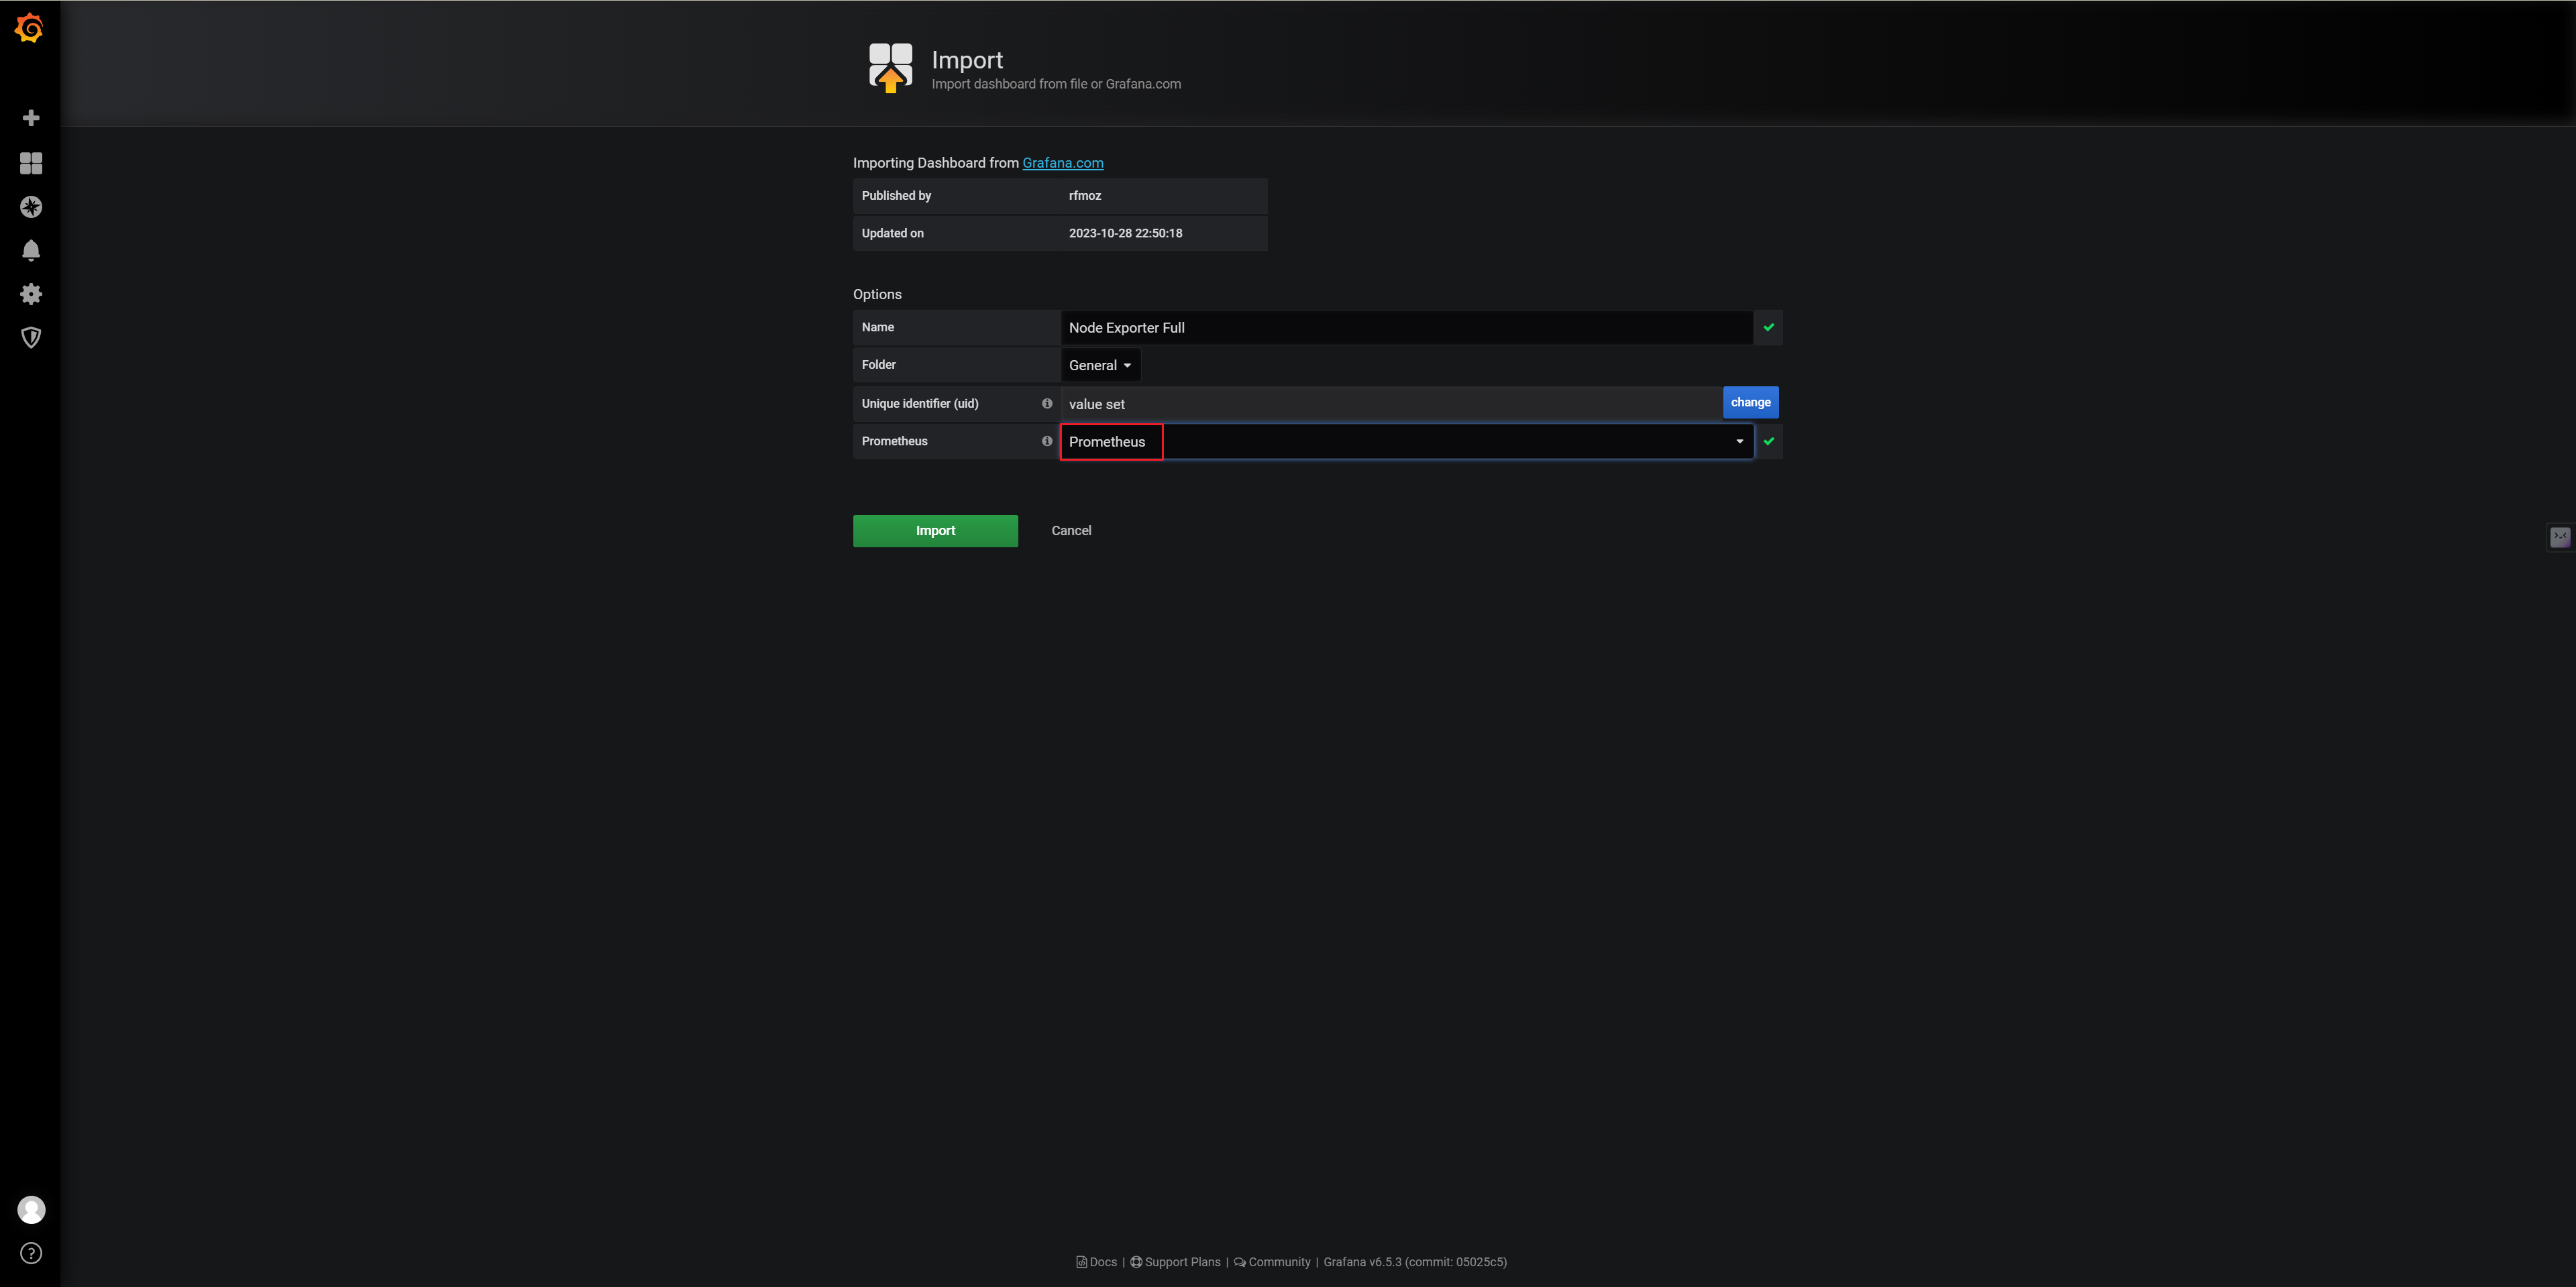
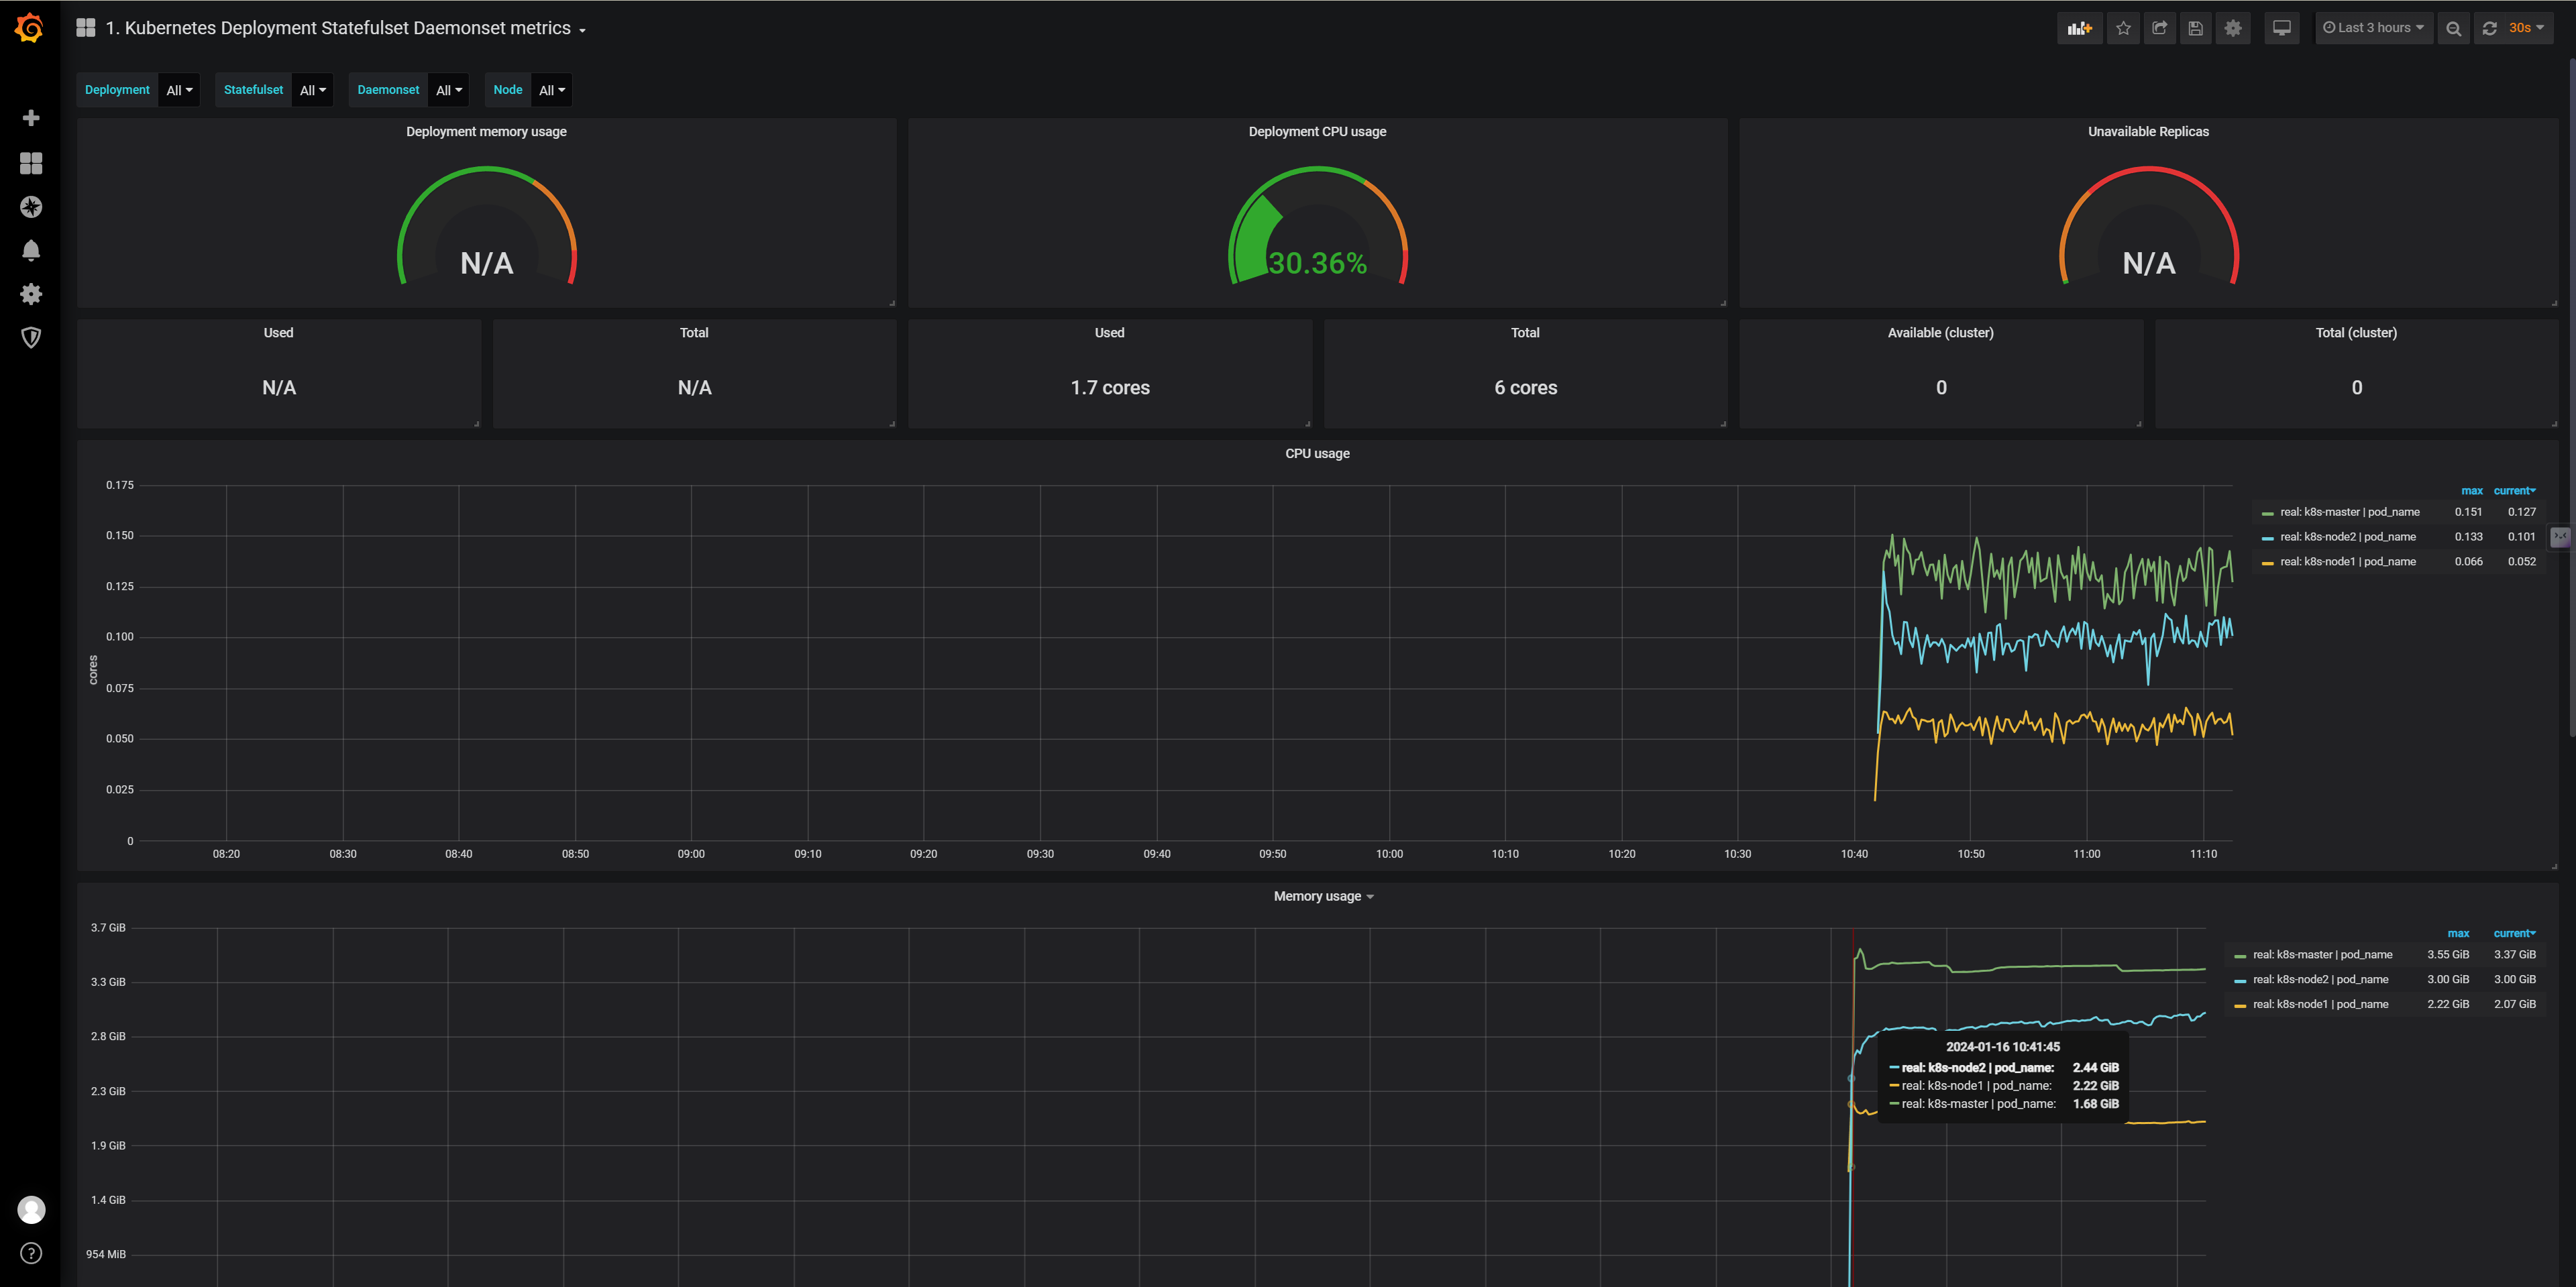
选择打开https://grafana.com/grafana/dashboards/8588-1-kubernetes-deployment-statefulset-daemonset-metrics/后复制ID,然后点击上图中的Import dashboard
粘贴ID后,选择数据源,然后import
基于kube-prometheus安装
如果已经使用自定义的方法安装了,要先执行kubectl delete -f prometheus卸载
换国内源
1
2
3
4
5
6
7
8
9
10
11
12
13
14
15
16
17
18
19
20
21
| sed -i 's/quay.io/quay.mirrors.ustc.edu.cn/g' prometheusOperator-deployment.yaml
sed -i 's/quay.io/quay.mirrors.ustc.edu.cn/g' prometheus-prometheus.yaml
sed -i 's/quay.io/quay.mirrors.ustc.edu.cn/g' alertmanager-alertmanager.yaml
sed -i 's/quay.io/quay.mirrors.ustc.edu.cn/g' kubeStateMetrics-deployment.yaml
sed -i 's/k8s.gcr.io/lank8s.cn/g' kubeStateMetrics-deployment.yaml
sed -i 's/quay.io/quay.mirrors.ustc.edu.cn/g' nodeExporter-daemonset.yaml
sed -i 's/quay.io/quay.mirrors.ustc.edu.cn/g' prometheusAdapter-deployment.yaml
sed -i 's/k8s.gcr.io/lank8s.cn/g' prometheusAdapter-deployment.yaml
grep "image: " * -r
|
安装
1
2
| kubectl create -f setup/
kubectl create -f manifests/
|
修改hosts文件
在hosts文件中添加下面内容
1
2
3
| 192.168.192.134 grafana.wolfcode.cn
192.168.192.134 prometheus.wolfcode.cn
192.168.192.134 alertmanager.wolfcode.cn
|
访问Granfana
直接访问 grafana.wolfcode.cn即可
添加数据源
然后可以创建Dashboard